Can Skilled Trades Workers Afford to Live Where They Work?


An original Trade-Schools.net metropolitan wage-and-housing study: May 2025 occupational pay versus legally applicable FY2027/FY2026 HUD rent benchmarks.
Eight trades. 203 directly comparable metropolitan markets. A revealing one-bedroom to two-bedroom affordability gap.
United States · Data snapshot November 14, 2026. These figures are occupation–metro calculations, not a claim about real households.
At a glance: the two-bedroom cliff
A higher salary does not necessarily make housing easier to afford. And a worker who passes a conventional one-bedroom rent screening calculation may fail it for a two-bedroom unit in the same metropolitan area.
In a comparison of 203 U.S. metropolitan areas where all eight predetermined skilled-trades occupations had usable wage and employment estimates, 346 of 1,624 occupation–metro combinations (21.3%) met a benchmark of rent at or below 30% of gross individual median pay for a one-bedroom unit, but exceeded it for a two-bedroom unit.
The same fixed set of comparisons cleared the one-bedroom benchmark in 1,309 cases (80.6%), compared with 963 cases (59.3%) for two bedrooms. These percentages describe occupation–metro calculations, not the percentage of tradespeople who personally can or cannot pay rent.
The result matters for someone choosing a trade, considering a relocation, or evaluating the difference between a nominal salary and the housing it might support. The underlying dataset covers more locations and trades than the fixed cohort, but the national comparisons are limited to the consistent eight-trade sample rather than mixing metros with different missing occupations.
One example: a second bedroom changes the answer in Greeley, Colorado
The official FY2027 HUD benchmark for Greeley is $1,307 per month for one bedroom and $1,647 for two. May 2025 BLS data put the area's median electrician wage at $63,290 annually. The one-bedroom benchmark consumes 24.8% of that gross wage; two bedrooms require 31.2%, above the conventional 30% screening line.
A median electrician wage would need to be $65,880 to meet the same two-bedroom benchmark, a $2,590 gap. This is not a landlord's approval decision or an estimate of a household's actual rent.
Across our eight comparable occupations, Greeley moves from eight passing for one bedroom to just one for two bedrooms. Industrial machinery mechanics, with a reported median wage of $75,610, still pass the two-bedroom benchmark at 26.1%; median welders and carpenters do not.
What the comparison reveals
One in five fixed-cohort pairs cross the bedroom threshold
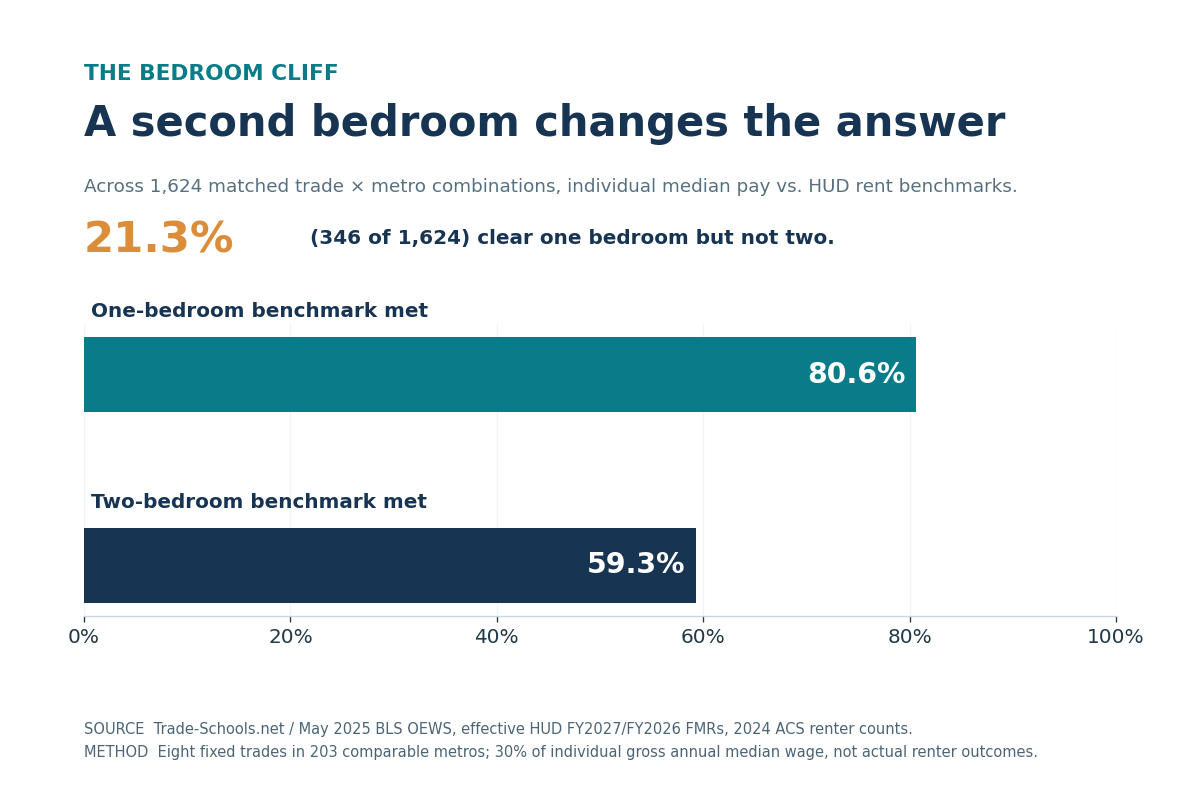
For each of the 1,624 comparable occupation–metro pairs, we tested two questions against the same local occupational median: Does a one-bedroom HUD-based monthly rent benchmark use no more than 30% of annual gross earnings? Does a two-bedroom benchmark also pass? A "bedroom cliff" means the first passes and the second fails.
A total of 346 pairs meet that exact definition. We found 36 of the 203 metros where none of the eight core occupations' reported medians met the two-bedroom screen, and 55 metros where all eight did. Those counts should not be generalized to every U.S. metro or every occupation.
The trade itself changes the result inside the same metro
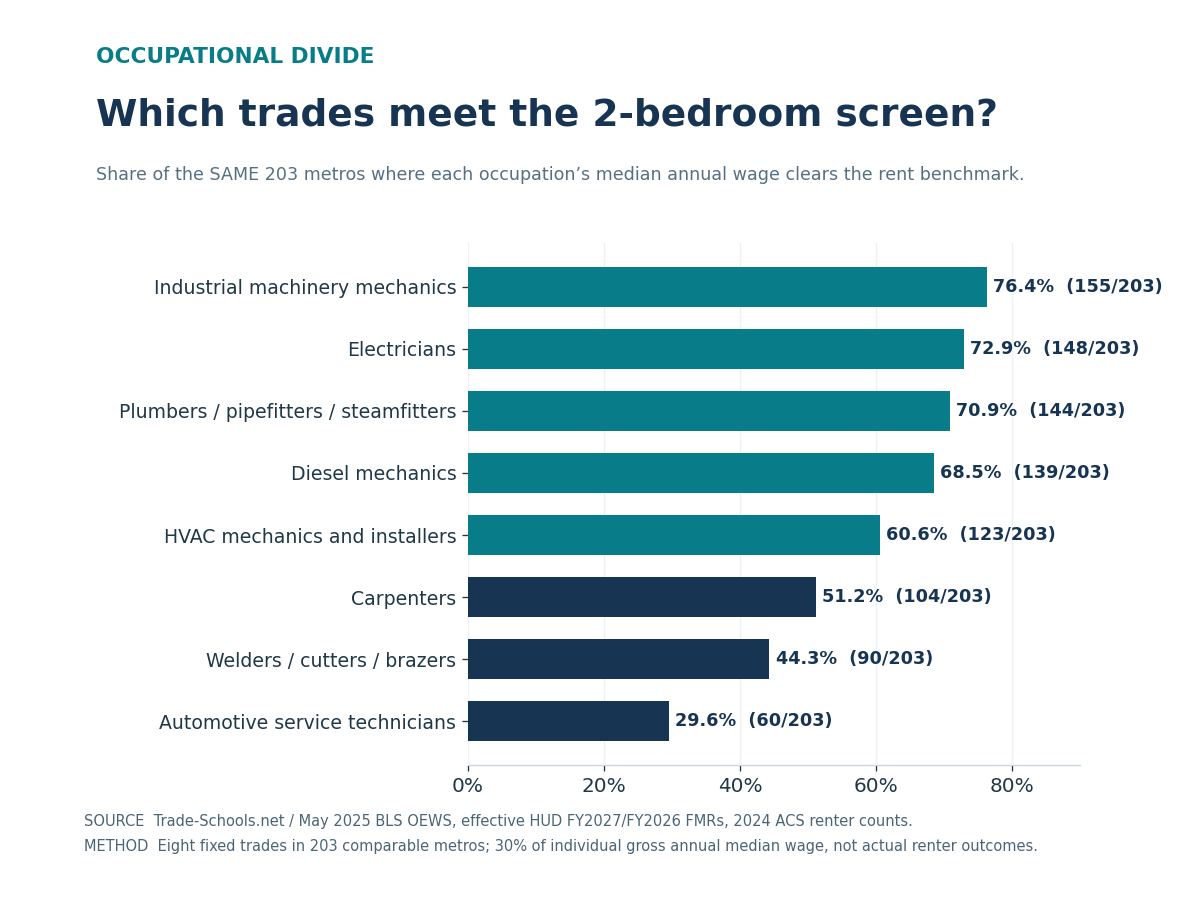
The occupations are not interchangeable. Industrial machinery mechanics met the two-bedroom test in 155 of 203 metros (76.4%). Automotive service technicians and mechanics did so in 60 of 203 (29.6%). Every occupation was evaluated across exactly the same 203 metropolitan areas.
| Occupation (short label) | 1BR pass | 2BR pass | Bedroom cliff | 2BR pass share |
|---|---|---|---|---|
| Industrial machinery mechanics | 184/203 | 155/203 | 29/203 | 76.4% |
| Electricians | 175/203 | 148/203 | 27/203 | 72.9% |
| Plumbers, pipefitters, and steamfitters | 170/203 | 144/203 | 26/203 | 70.9% |
| Diesel mechanics | 175/203 | 139/203 | 36/203 | 68.5% |
| HVAC mechanics and installers | 168/203 | 123/203 | 45/203 | 60.6% |
| Carpenters | 156/203 | 104/203 | 52/203 | 51.2% |
| Welders, cutters, solderers, and brazers | 147/203 | 90/203 | 57/203 | 44.3% |
| Automotive service technicians | 134/203 | 60/203 | 74/203 | 29.6% |
The figures compare published occupational pay distributions with rent benchmarks. They do not describe starting wages, apprentice pay, hours actually worked, or homeownership.
Local examples: different metros, different outcomes
| Metropolitan area | 1BR benchmark ($/mo.) | 2BR benchmark ($/mo.) | Core trades passing 1BR /8 | Passing 2BR /8 | Bedroom cliffs /8 | Rent geographic source |
|---|---|---|---|---|---|---|
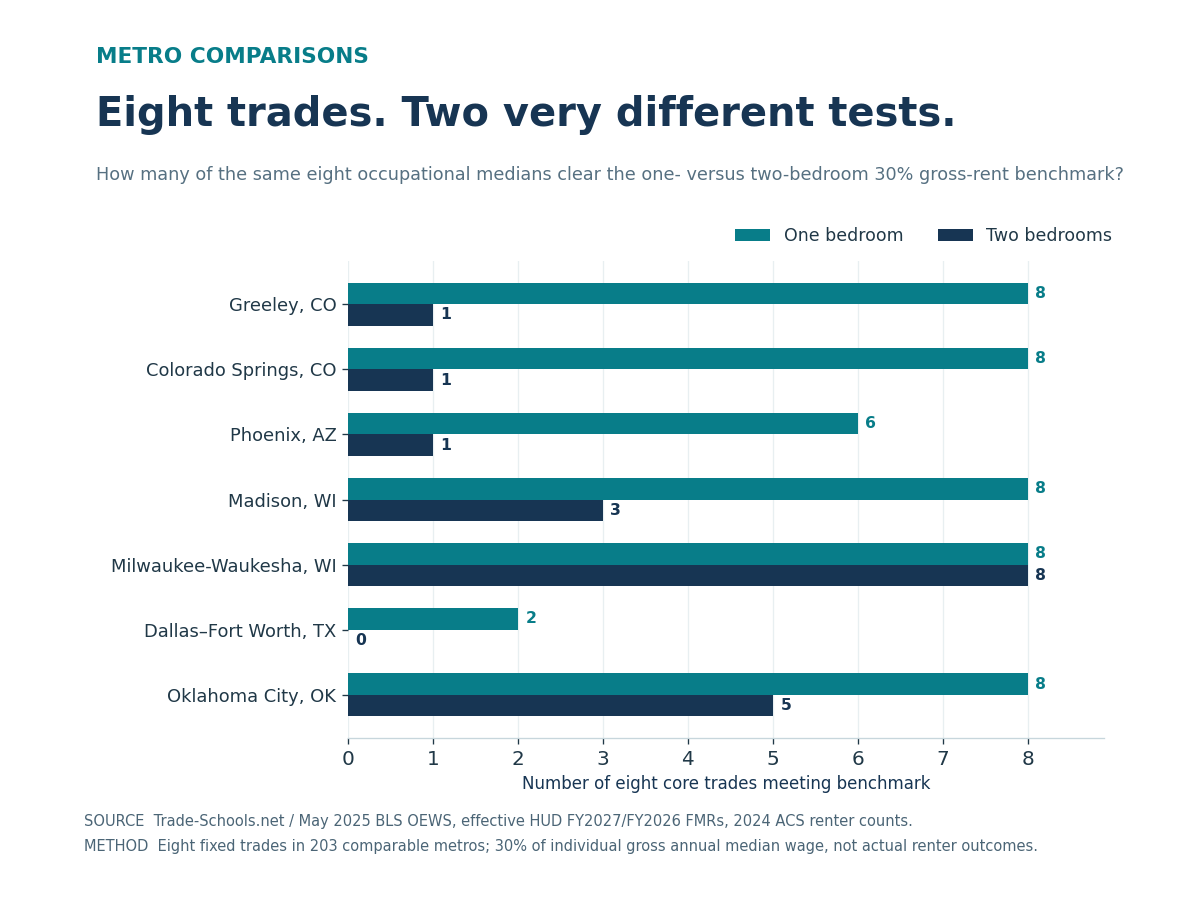
| Greeley, CO | 1,307 | 1,647 | 8 | 1 | 7 | Published HUD area |
| Colorado Springs, CO | 1,379 | 1,618 | 8 | 1 | 7 | Constructed |
| Phoenix-Mesa-Chandler, AZ | 1,493 | 1,734 | 6 | 1 | 5 | Published HUD area |
| Madison, WI | 1,419 | 1,635 | 8 | 3 | 5 | Constructed |
| Milwaukee-Waukesha, WI | 1,119 | 1,338 | 8 | 8 | 0 | Published HUD area |
| Dallas-Fort Worth-Arlington, TX | 1,517 | 1,786 | 2 | 0 | 2 | Constructed |
| Oklahoma City, OK | 1,031 | 1,253 | 8 | 5 | 3 | Constructed |
| San Francisco-Oakland-Fremont, CA | 2,631 | 3,231 | 0 | 0 | 0 | Constructed |
"Constructed" means a Trade-Schools.net renter-household-weighted combination of multiple HUD rental areas, not a single official HUD metropolitan 40th-percentile FMR. See methodology below.
In Colorado Springs, eight core trades pass the one-bedroom screen and just one passes the two-bedroom screen. Its metro rent measure is a constructed combination of HUD areas, so the component data and weights are available for independent review.
Phoenix provides another striking comparison: six of eight median wages meet the one-bedroom benchmark, but only industrial machinery mechanics still meet the two-bedroom benchmark. Its HUD rental benchmark is $1,493 for one bedroom and $1,734 for two. The area's median electrician wage is $61,210; a two-bedroom benchmark would consume 34.0% of gross pay.
Milwaukee presents a useful counterexample, with all eight core occupations meeting the two-bedroom screen in our fixed cohort, applying its legally effective FY2026 holdover rent figure. Different locations can reverse the outcome, even for similar job titles.
Explore your metro and trade
Explore median wages versus housing benchmarks
Interactive results include all 12 tracked occupations where May 2025 OEWS metro wages are reported. The national scorecard above uses only eight occupations across 203 eligible metros.
| Trade | Annual wage | Rent / month | Rent / gross wage | Required extra income | 30% screen |
|---|
Use the interactive explorer to select a metro, occupation, apartment size, and wage percentile. The explorer displays all reported cells across 380 matched metropolitan areas in the 50 states and Washington, DC and 12 occupations, including suppression and source flags. Its exploratory coverage is broader than the 203-metro fixed sample used for comparisons above. Do not rank metros by simple trade counts where occupational availability differs.
Select By metropolitan area to compare occupations in one market, or By occupation to examine a profession across reported markets. The 25th and 75th percentile are wage-distribution points; they are not "apprentice" or "senior" wage estimates.
You can download the complete occupation–metro analysis CSV, the comparable eight-trade scorecard, the component geographic audit, and the underlying method. No registration is required.
What this does, and does not, say about affordability
This is a standardized gross-income benchmark, not a personal budget. The conventional 30% share is one comparison tool; a household with two earners, children, significant debt, different work hours, high transportation costs, or an inherited low rent can reach a different conclusion. The study makes no claim about actual apartment availability, landlord approval, current asking rents, homeownership, or what the median worker pays.
The BLS figures represent wages for employees in the May 2025 Occupational Employment and Wage Statistics survey. They exclude self-employed proprietors and do not necessarily account for overtime premiums or seasonal layoffs. HUD FMRs are policy rent benchmarks, not advertised rent averages. FY2027 FMRs generally took effect October 1, 2026, but HUD lists specific FY2026 holdovers during reevaluation. Geographic labels can describe an entire metro in BLS and a smaller rental area in HUD.
Why wage percentile matters
A metro's 25th-percentile electrician salary is a wage observation at the lower quarter of the profession's distribution, not an apprentice-rate schedule. The 75th percentile does not equate to a specific experience level or license. Use both for sensitivity, not as promises about career progression.
Why geography can change the answer
BLS and HUD do not always report the same geography. We joined the May 2025 OEWS metropolitan areas to the matching OMB/Census county-equivalent assignments, applied effective FMR rules to each corresponding HUD rental area, and combined county benchmarks using 2020–2024 ACS renter-occupied housing-unit counts when required. This produces a TSNET-constructed renter-weighted benchmark wherever a BLS metro contains multiple HUD areas. It is not itself a pooled HUD 40th-percentile estimate.
We excluded six Puerto Rico metropolitan areas from the original 393-area BLS source to keep the study within the 50 states and Washington, DC. We also excluded seven metropolitan areas whose component New England county/town FMR differences could not be represented reliably using county-level renter weights; their raw wage records remain in the original BLS source, but they are not in the explorer. Uniform-rent town counties were retained only when the published component figures were identical.
The results are sensitive to some legitimate choices
Our main 203-metro eight-occupation cohort requires each occupation's published median, at least 100 estimated local employees, and a BLS employment relative standard error no greater than 15%. That restriction improves comparability but also selects for metros with more complete occupational data. It is not a statistically representative sample of all workers.
When we remove the 15%-PRSE restriction while retaining the eight-trade and employment rules, 262 metros qualify and 22.1% of pairs cross the bedroom threshold (versus 21.3% in the main sample). When restricting the main cohort to only exact HUD FMR-area matches, 113 metros remain and the share is 20.1%. Both checks leave the central pattern intact, but different sample definitions change the measured rate.
Within the fixed cohort, 70 of 1,624 two-bedroom pass/fail decisions change if we use an unweighted county rent average rather than renter-household weighting. Those are genuine methodological sensitivities, not measurement errors to hide. We provide component audit files so readers can reproduce and challenge the weighting choice.
A 30% cutoff is a descriptive reference, not a bright line in real economic well-being. Moving the cutoff to 29.5% yields a 22.6% bedroom-cliff share, while 30.5% yields 21.0%. Borderline metro–occupation cells should never be framed as certain personal outcomes.
Methodology: data and calculations
- Wages: BLS OEWS May 2025 Metropolitan and Nonmetropolitan Area Occupational Employment and Wage Estimates, released May 15, 2026; original MSA workbook. We used SOC-specific published annual median wages without substituting state/national values for suppressed local cells.
- Rental benchmarks: HUD FY2027 county/town FMR schedules, generally effective October 1, 2026. The legally effective revised FY2026 FMRs apply to the 12 held FMR geographies identified in the HUD FY2027 reevaluation notice; the notice's 13th hold pertains to two ZIP codes in nonmetropolitan Grafton County, NH, outside this metro study. We applied the exceptions to the exact HUD subareas, not whole BLS metros by name. The six other valid-request areas and Grand Rapids use FY2027 rates.
- Geography: BLS May 2025 area definitions checked against the July 2023 OMB/Census delineation; 393 source metropolitan areas (including six in Puerto Rico), 387 within the 50 states and DC, and 380 with usable geographically matched rental measures. County differences inside several New England metros led to seven exclusions.
- Weights: ACS 2024 five-year B25003 estimated renter-occupied housing units (2020–2024) at county/county-equivalent level. For multi-HUD-area BLS metros, monthly FMR is the sum of county FMRs times renter households divided by the total renter households. County-level renter weighting does not capture varying town/ZIP rents, so nonuniform town-rent counties were excluded rather than estimated.
- Occupations: Twelve selected SOCs are available in the explorer. The eight-occupation fixed cohort uses electricians (47-2111), plumbers/pipefitters/steamfitters (47-2152), HVAC mechanics/installers (49-9021), carpenters (47-2031), welders/cutters/solderers/brazers (51-4121), diesel engine specialists (49-3031), industrial machinery mechanics (49-9041), and automotive service technicians/mechanics (49-3023).
- Equations: Annual benchmark rent = 12 × monthly rent; gross rent burden = annual benchmark rent / BLS annual wage; wage required at 30% = 40 × monthly rent; wage gap = required wage − occupational median annual wage. We use unrounded values for screening comparisons, then round for display.
- Suppression: Unpublished BLS wage or employment values remain missing, never zero. Small-employment and high-PRSE rows are shown with cautions but excluded from fixed-cohort rankings. SOC categories such as "Plumbers, Pipefitters, and Steamfitters" are not silently narrowed to plumbers alone.
- Audit: Recomputed every included wage/percentile/employee field against the original BLS workbook, performed 35 independent metro-rent spot checks, rechecked the 12 held HUD area identifiers, and independently recalculated all 203 fixed-cohort scorecards. The technical download includes row-level source identifiers, geographic exclusions, and method-sensitivity tables.
Source documents: BLS OEWS Tables · BLS OEWS Program Overview · HUD FMR Data Portal · HUD FY2027 Reevaluation Notice · U.S. Census 2024 ACS Five-Year Table B25003.
Download the original analysis
The full data, fixed-cohort scorecard and metro geography audit are free to download. The source workbooks are publicly available from BLS, HUD and Census.
Using and citing this research
You may use charts, publish specific findings, and adapt our derived data with attribution to Trade-Schools.net and the official federal sources. Suggested source credit:
Trade-Schools.net, Skilled Trades Housing Affordability Study (2026), analysis of BLS May 2025 OEWS metropolitan occupational wages and effective HUD FY2027/FY2026 Fair Market Rents, with ACS 2024 five-year renter-household weights. https://www.trade-schools.net/articles/skilled-trades-housing-affordability
For an original-data finding, link to this permanent study URL so readers can inspect the methodology and the underlying data. Attribution is requested, not enforced through keyword-stuffed anchor text or invisible widget links.
Further career research
For state-level pay and openings, employment demand, and training choices, these guides cover decisions this affordability benchmark does not address.