
What's your major?
Last Updated
 On college campuses around the world, this is quite possibly the most common ice breaker—and it's a loaded one. In fact, up to 80 percent of college students change their major at least once during their university experience, and around 20 to 50 percent of freshmen enter college without deciding on a field of study. It's very common for students to go to school, realize their initial choice just isn't for them, fall in love with something else, and switch degrees.
So how do these students feel after they've declared a major, powered through their degree program, and headed out into the workforce? We asked over 1,000 college graduates to find out.
Major Satisfaction
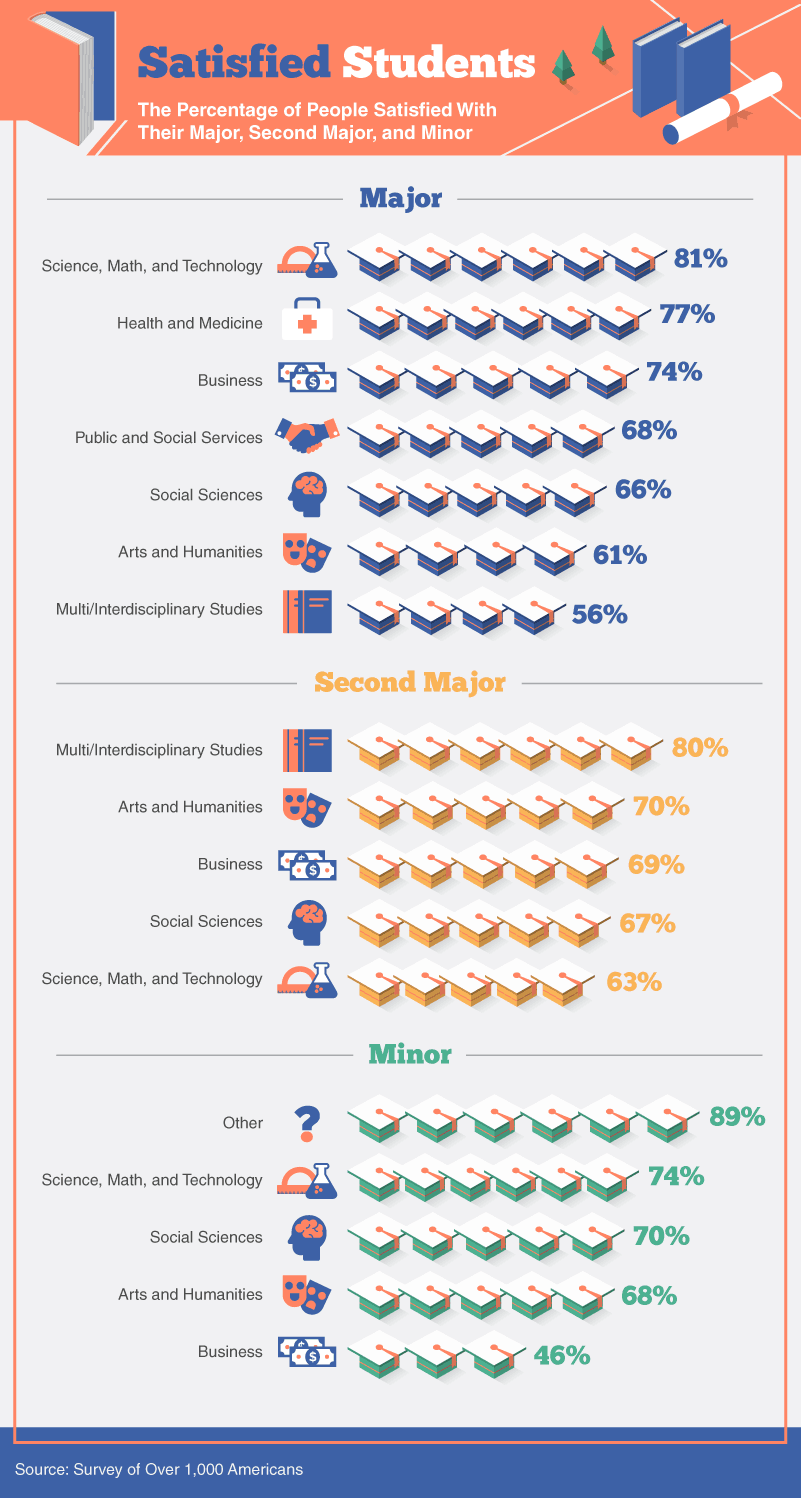
Who was most likely to be satisfied with their major decision? According to our survey, it was science, math, and technology grads—a fact that may come as no surprise when you consider the median salary for software developers is over $98,000 per year, the IT sector is continuously hiring, and chemical engineers are projected to see 10 percent job growth, offering promising opportunities for new graduates.
Health and medicine and business graduates were also highly satisfied with their choice in major. However, students least likely to be happy with their major were those in multidisciplinary studies.
Interestingly, satisfaction flipped when it came to second majors, with multidisciplinary studies ranking highest, and science, math, and technology ranking lowest.
As for minors, science, math, and technology ranked high again, followed by a high satisfaction rate for those with social sciences and arts and humanities minors.
Guaranteeing Your Satisfaction
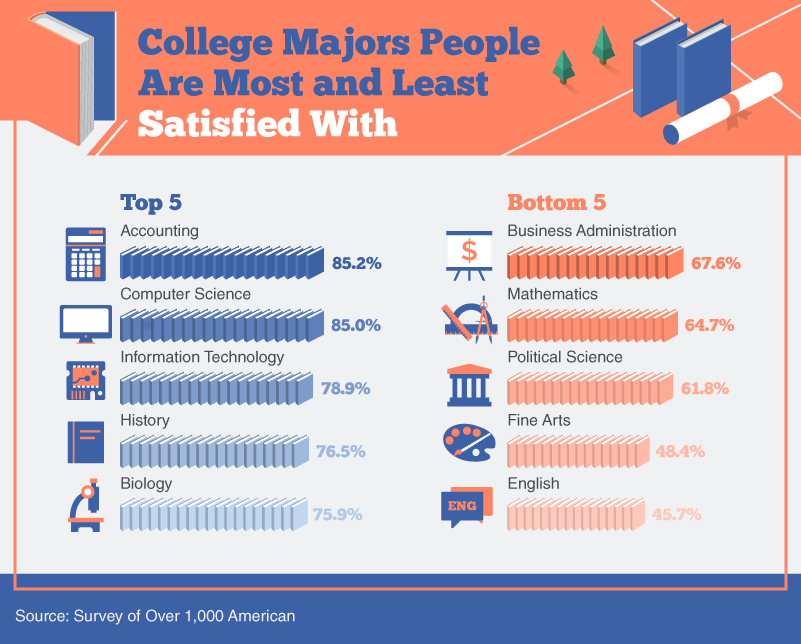
When we drilled the data down to look at specific majors, an even more interesting picture emerged. Those most likely to be satisfied with their major were accounting, computer science, and information technology grads—again no surprise when you consider these career tracks have a reputation for year-over-year growth, higher salaries, and low-stress jobs.
Perhaps more of a surprise was the majors with the lowest satisfaction levels: English, fine arts, and political science. Despite passionate English majors encouraging new students to do what they love, English was the least satisfactory degree for our survey respondents.
Majors Grads Wish They Had Pursued
If our college grads had to do it over again, which majors would they pursue?
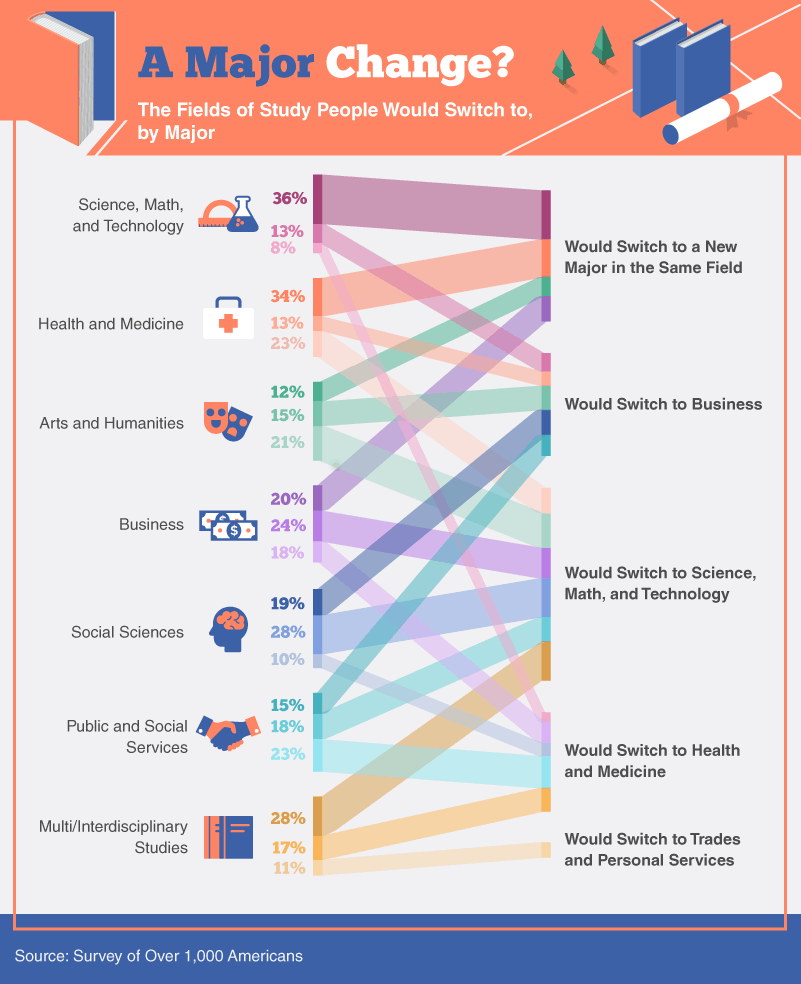
The answer, again, was science, math, and technology—23 percent of health grads; 21 percent of arts and humanities grads; 24 percent of business degree holders; 28 percent of social sciences grads; 18 percent of public and social services grads; and 28 percent of multidisciplinary grads said that would be their top choice for a switch.
Among science, math, and technology grads, the most common answer was they'd stay in the same field but switch to another major within this field.
Majors by Gender
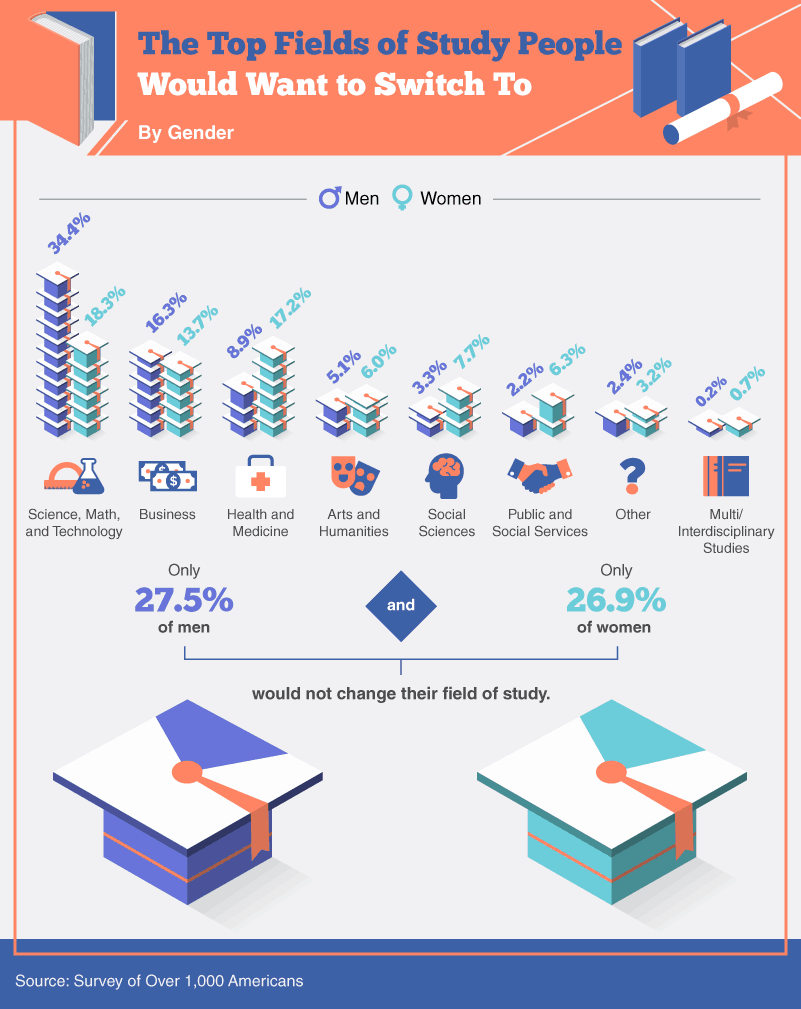
When it comes to major regrets, is there any difference between men and women? We split the data to find out—and the results were fascinating.
As it turns out, men were almost twice as likely as women to switch to STEM degrees, a finding that makes sense since the STEM field is still predominantly male despite ongoing efforts to recruit more women. Women, on the other hand, were about twice as likely to want to switch to a health-related major.
When Did You Choose Your Major?
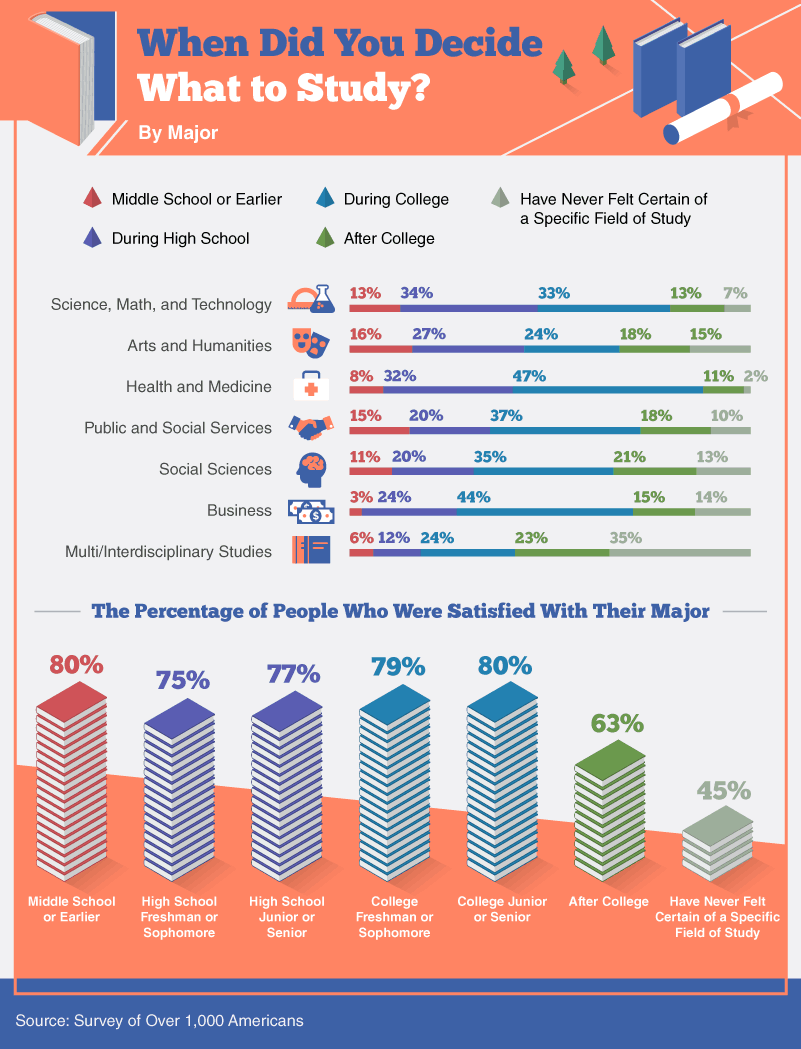
Have you dreamed of being a doctor since you were in grade school? Committed to coding since your teen years? Or did you switch majors mid-education to pursue psychology? We asked survey respondents when they knew what they wanted to do with their life.
For those who majored in multidisciplinary studies, a sobering 35 percent never felt sure of their degree decision. More than one-third of science, math, and technology grads were hooked from high school. And most health and business professionals decided their course during college.
As you might expect, certainty about a career path seemed to correlate with degree satisfaction—80 percent of those who were certain in middle school or earlier cited satisfaction with their major compared to 45 percent of those who never felt certain about a specific field of study.
Why Change Majors?
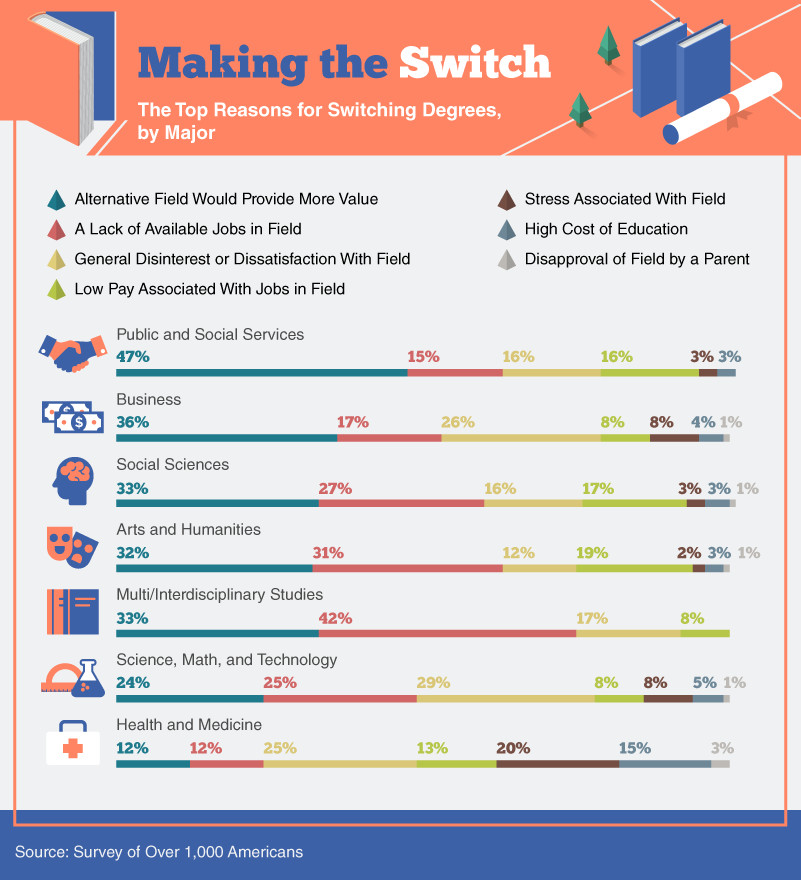
For the 80 percent of students who changed majors at least once during their college years, what were their motivations behind this change? We asked participants and found reasons varied by major.
For those who switched from public and social services and business, the value of their major was often in question. Those in the arts and humanities and multidisciplinary studies were more often concerned about available jobs in their field. And for STEM students, the most common reason for switching degrees was a disinterest or dissatisfaction with the field.
However, health and medicine students were the most likely to switch because of the stress associated with their career field. They also cited parental disapproval as a big reason for switching.
The Major Influence of Parents
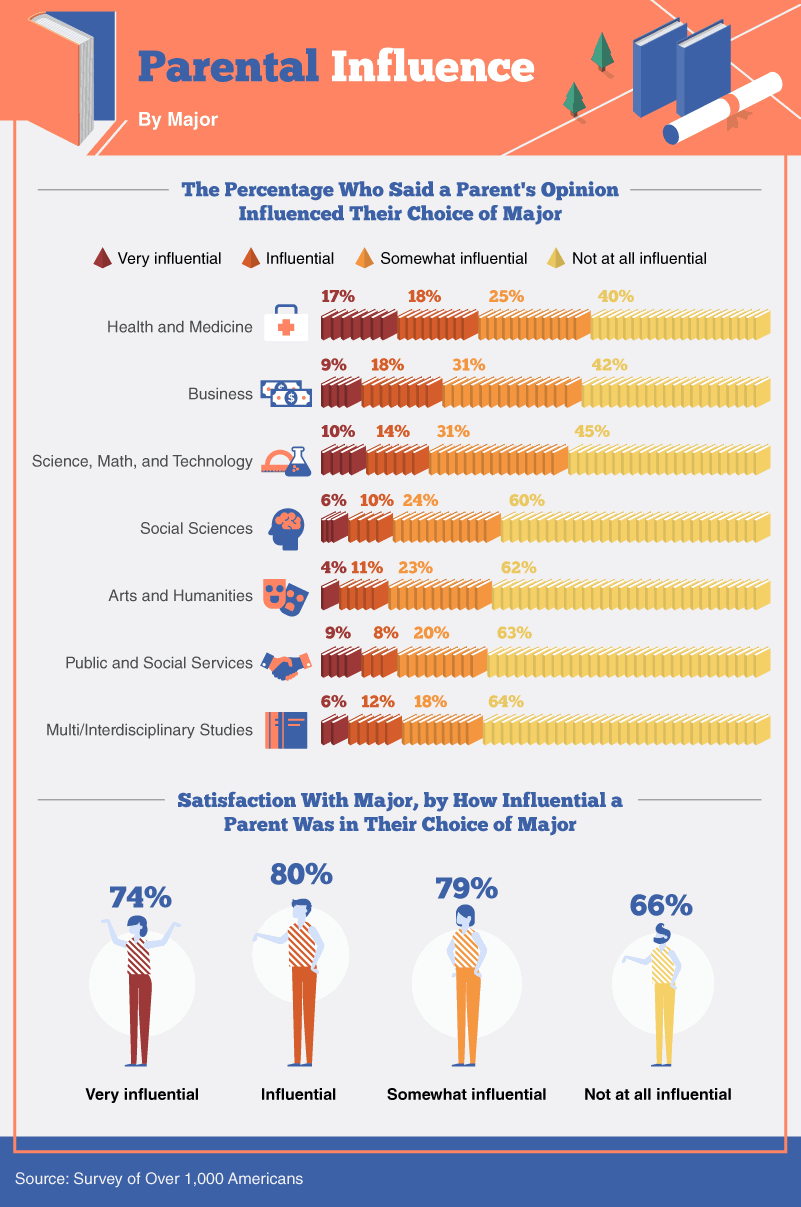
Speaking of parents, how much influence do they have on their kids' degree decisions?
After the above revelation, it may come as no surprise health and medicine grads ranked parental influence highest, with 17 percent saying their parents' opinions were "very influential" when deciding on their major, and only 40 percent saying their parents were "not at all influential."
Business, STEM, and Public and Social Services grads also ranked parental influence higher than average, calling it "very influential" about twice as often as Social Sciences, Arts and Humanities, and Multidisciplinary students. In fact, multidisciplinary students were the least likely to benefit from parental input, with 65 percent of multidisciplinary grads said their parents had no influence on their field of study.
Degree satisfaction seemed to vary little between those whose parents had at least some influence on their area of study, but those who said their parents had no influence were less likely to be satisfied than any other group.
How Often Do Degrees Match Up With Real-World Jobs?
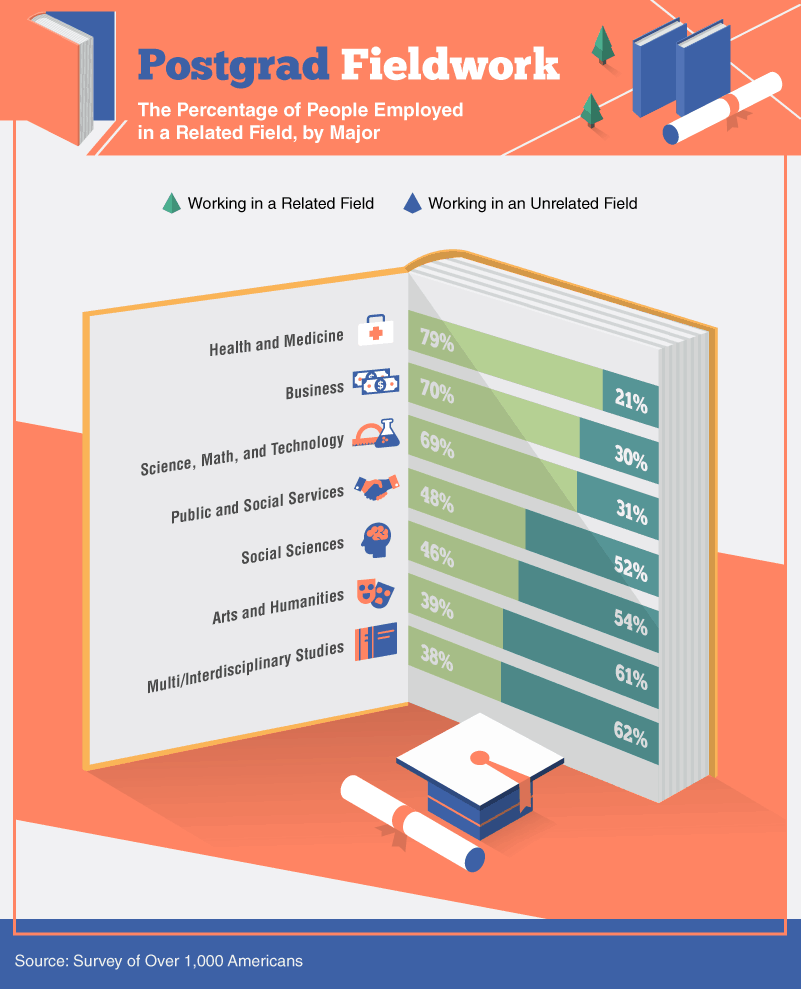
Satisfied or not, how many of college grads are working in a field related to their study?
The highest percentage of job and degree correlation went to health and medical professionals, 79 percent of who work in their area of study. Business pros and STEM grads were also likely to work within their discipline—at least in part because there are more jobs than qualified candidates.
Those least likely to be in a field related to their major were multidisciplinary grads and those in the arts and humanities.
Major Decisions Ahead
All in all, STEM grads were the most satisfied with their major—most likely because of high growth rates, higher salaries, and low-stress levels. Grads were also more likely to be satisfied if their parents had a little input. And across all majors, the participants most satisfied were those who went with their middle school dreams—something our last study also seems to confirm.
Methodology
We surveyed 1,035 Americans and asked them questions related to their college education. Fifty-six percent of respondents identified as men, 44 percent of respondents identified as women, and less than 1 percent identified as a gender not listed by our survey. The most popular fields of study were majors related to science, math, and technology, with 29 percent of total respondents. Majors related to the trades and personal services were omitted from results, with only five respondents.
Additional Source
- Harvard Business Review, Why Do So Many Women Who Study Engineering Leave the Field?, website last visited on June 24, 2020.
Fair Use Statement
Want to share our findings with your students, parents, and college hopefuls? You've got our permission. Just make sure to link back to us whenever you use our infographics.